Overview
Our work focuses on the implementation of microfluidic network (μFN) platforms for the development of new bioassays and diagnositics in micro total analytical systems (μTAS). Several examples of ongoing research are highlighted below, and at the bottom of the page, contact information for participating faculty members.
Prospective graduate students are encouraged to contact us for information regarding research opportunities leading to MS and PhD degrees in chemical engineering, bioengineering, chemistry, and electrical engineering. We particularly invite undergraduate students to work in our laboratories as members of vibrant, interdisciplinary research teams.
Multiplexed biomolecule and virus detection
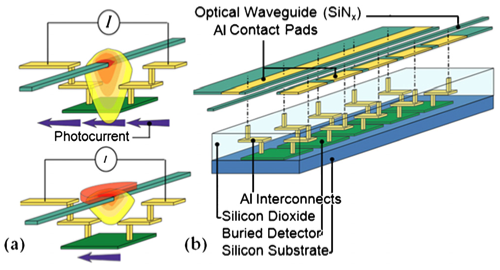
A local, evanescent, array-coupled (LEAC) sensor based on a compact, single-mode optical waveguide (IOW) is being developed by the Dandy, Lear, and Henry groups for multianalyte sensing of targets ranging from small biomolecules to virus particles. The LEAC sensor is a promising platform for point-of-care diagnostics. The sensor fabrication is compatible with trailing-edge complementary metal oxide semiconductor CMOS technology, which both lowers its cost and makes it possible to build a portable lab-on-a-chip system with silicon integrated circuits.
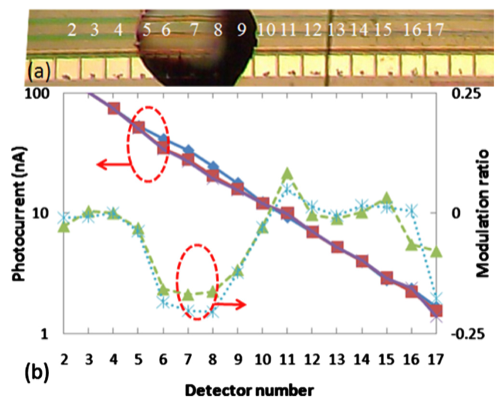
In the lower right figure, panel (a) shows a microscope image of a LEAC sensor chip with goat antimouse IgG solution printed above detectors 5 through 9 before rinsing. The capture antibodies were not fluorescently labeled, so that the patterned spot, which was 1 nm thick after rinsing and drying, could not be observed under an optical microscope. The detector pitch is 100 μm. Panel (b) show a plot of the photocurrents measured before (blue diamonds) and after the goat antimouse IgG (red squares)/mouse IgG crosses was patterned as well as the respective current ratios (triangles and stars). As expected, incubation with the target solution decreased the measured photocurrent under the probe spot due to specific binding of the target antigen. On detectors 6–8, a 16.3% average modulation ratio was observed due to the presence of the goat anti mouse IgG antibody patterning.
Passive and active micromixing strategies
It is recognized that mixing plays an important role in the growing use of microfluidic devices for lab-on-a-chip applications. For applications ranging from DNA separation and amplification to protein crystallization and kinetics studies, the performance of a lab-on-a-chip device is directly related to the rate at which two or more fluids can be mixed. Due to the small dimensions of microchannels as well as the limited range of obtainable linear flow rates, flow in microchannels is confined to the laminar regime and mixing is dominated by molecular diffusion.
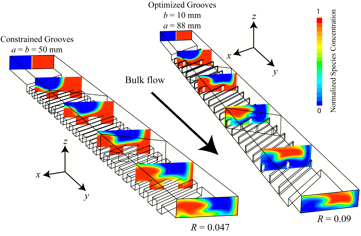
With the goal of further simplifying fabrication of a micromixer, we are developing a new method for achieving chaotic advection through application of a localized electric field perpendicular to the mean flow direction driven by a pressure gradient in a planar rectangular microchannel. The electric field, created by a potential drop across an integrated electrode gap, drives electro-osmotic flow (EOF) perpendicular to the main flow direction, thereby creating a secondary recirculation flow profile.
Through control of the electrode geometry-gap width, gap location, and axial separation, it is possible to induce rapid mixing in short axial distances. This device, a superposition of transverse electro-osmotic and axial pressure driven flow, is referred to as an electro-osmotic chaotic advection micromixer (eCAM).
Passive pumping
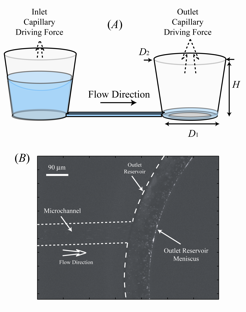
Controlled pumping of fluids through microfluidic networks is a critical unit operation ubiquitous to lab-on-a-chip applications. Although there have been a number of studies involving the creation of passive flows within lab-on-a-chip devices, none have shown the ability to create temporally stable flows for periods longer than several minutes. We have developed passive pumping approach in which a large pressure differential arising from a small, curved meniscus situated along the bottom corners of an outlet reservoir serves to drive fluid through a microfluidic network. The system quickly reaches steady state and is able to provide precise volumetric flow rates for periods lasting many hours.
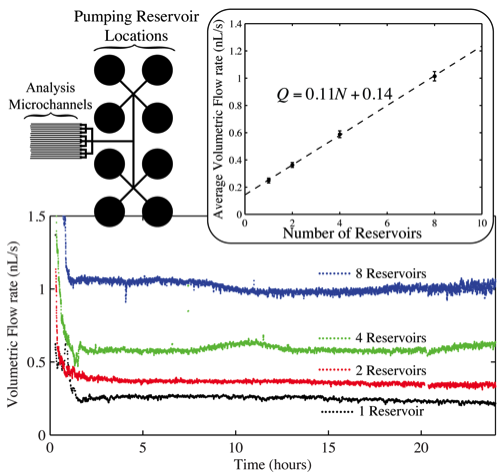
While it has been shown that the volumetric flow rate Q of liquid through the μFN may be controlled via the channel and reservoir geometries, a larger dynamic range of flow rates may be achieved by coupling the μFN to multiple outlet (pumping) reservoirs. This scnario is illustrated on the left side of the bottom right figure, where the μFN has been connected to 8 pumping reservoirs. Using simple valving techniques it is straightforward to use anywhere from 1 to 8 of the reservoirs. The pumps consist of small, O(mm) diameter, vertical reservoirs at the terminal end of the microfluidic network connected to the sample reservoir. It can be seen from plot that increases in volumetric flow rates are achieved by increasing the number of pumping reservoirs in operation, where steady-state flow is maintained for 24 hours in all cases. The inset displays the average volumetric flow rate for each data set (1 ≤ t ≤ 24 h) as a function of the number of reservoirs (N) in operation; the relationship between Q and N is clearly linear. It is expected that provided a satisfactory μFN design, this relationship can be extrapolated indefinitely to higher values of N.
For purposes of robustness, it is important to be able to pump the multitude of solutions associated with biological systems, where the range of fluids encountered vary from being simple and dilute (phosphate buffered saline) to complex in nature (growth media, blood serum). This complexity can be problematic for this passive pumping technique due to both the presence of the air/water interface and the large surface area to volume ratio inherent at the microscale. In particular, small amounts of evaporation can often lead to solute crystallization and the overall failure of the pumping process. One simple method to prevent solute crystallization is to maximize the space time τ of the reservoir, that is, the ratio of the liquid volume in a pumping reservoir to the flow rate into the reservoir. Essentially, solutes within pumping reservoirs with a large value of τ will become concentrated less rapidly than those in a reservoir with a smaller value of τ.
Spatially resolved samping
The spatial and temporal distributions of diffusible molecules play an important role in a wide variety of biological and chemical processes. The formation and maintenance of these distributions is a complex function of the local fluid convection profiles, the diffusivities of the chemicals in question, and chemical reactions that take place. There are many applications in which these chemical distributions possess characteristic length scales on the order of 1 to 1000 μm.
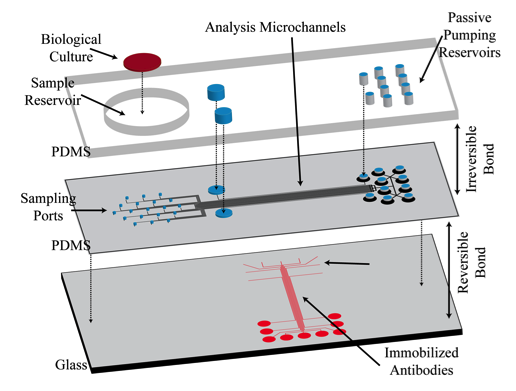
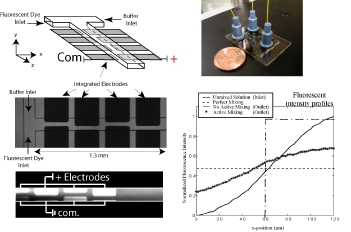
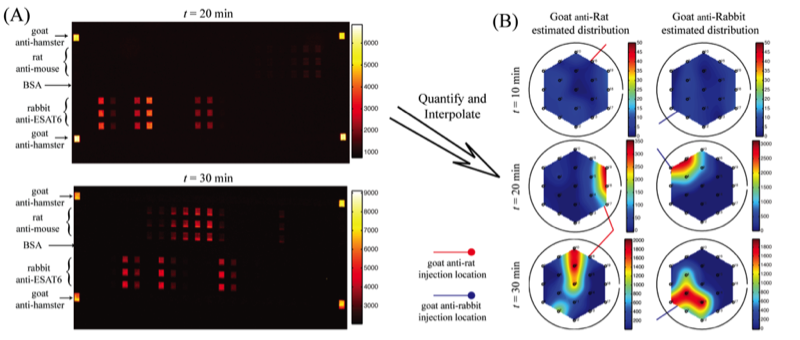
In a proof-of-concept study a micromosaic assay was used to map the location of analyte in a sample reservoir. First, a μFN was used to covalently immobilize three sets of antigens to a functionalized glass slide in discrete, 40 μm wide stripes. In this case, two of the antigens are used for spatial detection purposes (rat, rabbit IgG) while a third is used for alignment purposes (goat IgG). Then, a spatial assay similar to that shown in the upper right figure was reversibly sealed to the glass slide in a manner such that the analysis microchannels were orthogonal to the immobilized antigen stripes. After filling the sample reservoir with a solution of 45 mg/mL BSA in PBS and allowing the flow to reach steady state, a GC syringe and a micromanipulator were used to inject two separate 0.3 μL plugs of 0.67 mg/mL fluorescently tagged IgG (anti-rat, anti-rabbit) in different locations just above the reservoir floor. Panel (A) below shows fluorescent images of the spatial micromosaic assay for assays of t = 20 and 30 min. The goat/anti-goat system serves both as an alignment tool for image quantification and if needed, a calibration source for the remaining antigen/antibody systems. Using an interpolation scheme, the species distributions may be estimated and these are shown in panel (B). These signals provide clear insight into the spatial distributions of the respective antibodies near the floor of the sample reservoir, and can be easily calibrated to account for non-equilibrium effects.
Collaborators
| Prof. Kenneth F. Reardon 1370 Campus Delivery Colorado State University Fort Collins, CO 80523-1370 (970) 491-6505 kenneth.reardon@colostate.edu Reardon web site |
Prof. Kevin L. Lear 1373 Campus Delivery Colorado State University Fort Collins, CO 80523-1373 (970) 491-0718 kevin.lear@colostate.edu Lear web site |
|
Prof. Charles S. Henry 1872 Campus Delivery Colorado State University Fort Collins, CO 80523-1872 (970) 491-2852 chuck.henry@colostate.edu Henry web site |
Prof. Stuart A. Tobet 1617 Campus Delivery Colorado State University Fort Collins, CO 80523-1617 (970) 491-1672 stuart.tobet@colostate.edu Tobet web site |
|